SPECIAL MENU: Articles Index | Research Search Engines | References
Last Updated: 02.02.2020
From our previous post on R “nought” (the basic reproduction number), R0 is a best estimation and defined as: “the average number of secondary infections generated by the first infectious individual in a population of completely susceptible individuals” (CIDD, 2014a; CIDD, 2014b).
If R0>1, then the outbreak is likely to continue; if R0<1, then the outbreak has a better potential for being contained (Delamater et al. 2019). Anticipated outbreak/epidemic size is commonly based on R0 as is the estimation of the number of people needing to be vaccinated (Delamater et al., 2019).
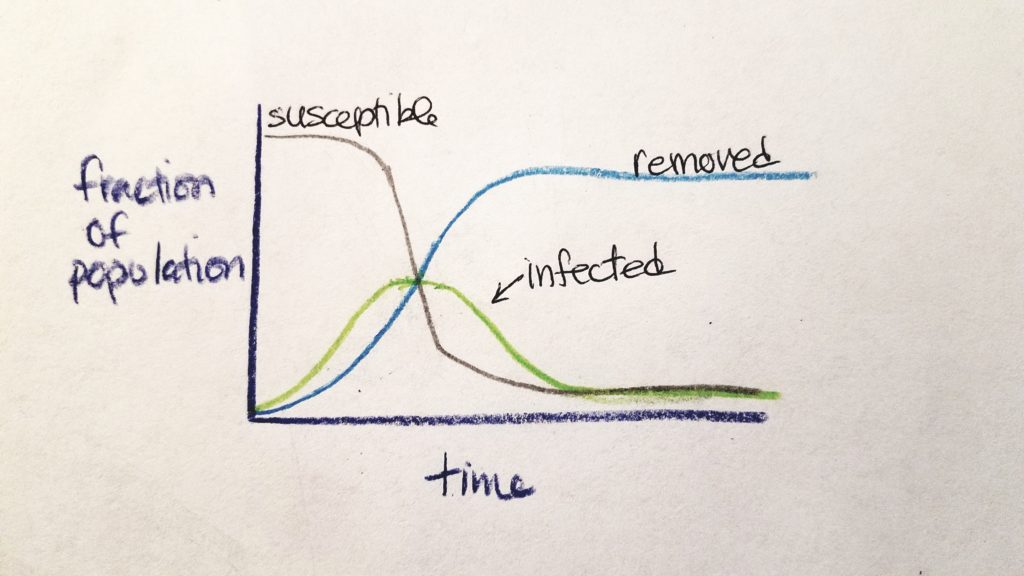
R0 values are calculated early at the onset of an outbreak. As time goes on, the nature and numbers of the outbreak change. At the beginning, most people are susceptible and the rate of potential transmission is exponentially great. As time goes on, people are either susceptible (S), infected (I), or removed from the chain of infection as non-susceptible (R) (either they are immune and regain health or they are dead) (CIDD, 2014b). The rate of susceptible people and infected people decreases as the rate of removed people increases.
This was explained by CIDD (2014b) as a “stylized” model called SIR Compartmental Framework (S=susceptible, I=infected, R=removed).
The speed of increase of infected individuals depends on R0 and the infectious period–higher R0 and shorter infectious period models a more prolific spread of the disease (CIDD, 2014b). As time goes on and assuming that more individuals are not added into the original population, the number of susceptible individuals decrease (either they died or regained their health).

The effective reproductive number (RE) is the average number of new infections later in the epidemic. RE(t) is defined as a function of time (t): the average number of secondary infections caused by a newly infected individual at time, t (Chirombo, Diggle, Terlouw, & Read, 2018).
RE is a product of R0 and the fraction of susceptible population: RE = R0 x fraction_of_susceptible_population (CIDD, 2014b). If RE < 1, the epidemic is self-limiting and said to be under control due to countermeasures (CIDD, 2014b; Chirombo et al., 2018). When the proportion of susceptible individuals is less than 1/R0, we call this “the point at which the population reaches herd immunity” (CIDD, 2014b).
Herd immunity is best defined by Wikipedia (2002) as: “a form of indirect protection from infectious disease that occurs when a large percentage of a population has become immune to an infection, thereby providing a measure of protection for individuals who are not immune”. Other definitions mention vaccination, but Wikipedia’s definition is more generalized (and most applicable) while retaining the same meaning.
As of January 26th, 2020 Zhang & Wang (2020) estimated RE for 2019-nCoV to range between 3.3-5.5 which concur with other studies (Cao et al., 2020).
References
Cao, Z., Zhang, Q., Lu, X., Pfeiffer, D., Jia, Z., Song, H., & Zeng, D. (2020). Estimating the effective reproduction number of the 2019-nCoV in China. medRxiv. https://doi.org/10.1101/2020.01.27.20018952
Center for Infectious Disease Dynamics (CIDD). (2014a, March 19). Week 1 Video 5: Reproductive Number [Video]. https://youtu.be/ju26rvzfFg4
Center for Infectious Disease Dynamics (CIDD). (2014b, March 19). Week 1 Video 6: Epidemic Curve [Video]. https://youtu.be/sSLfrSSmJZM
Chirombo, J., Diggle, P. J., Terlouw, D. J., & Read, J. M. (2018). Estimation of spatially varying effective reproduction numbers for infectious disease epidemics. Modelling spatial processes of infectious diseases, 39.
Delamater, P. L., Street, E. J., Leslie, T. F., Yang, Y. T., & Jacobsen, K. H. (2019). Complexity of the basic reproduction number (R0). Emerging infectious diseases, 25(1), 1.
Wikipedia. (2002, September 18). Herd immunity. https://en.wikipedia.org/wiki/Herd_immunity
Zhang, C., & Wang, M. (2020). Origin time and epidemic dynamics of the 2019 novel coronavirus. bioRxiv.
